-
Calculation groups in Power BI desktop
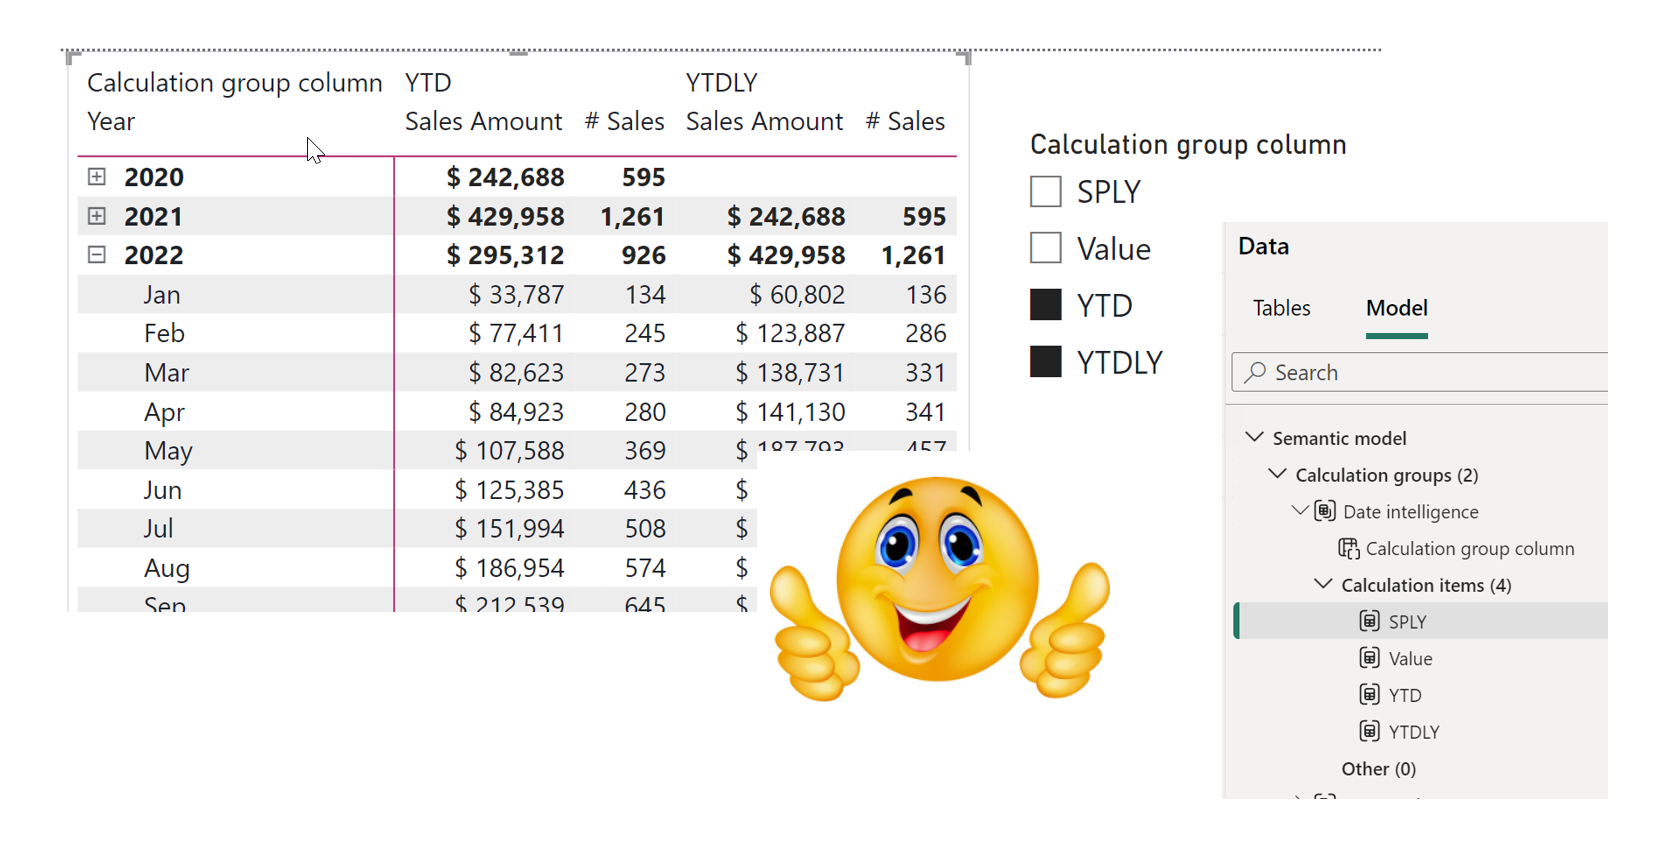
In the October 2023 update of Power BI desktop, we got the preview feature “Model explorer and Calculation groups”. One of the great things about that update, is that we now can make calculation groups directly in Power BI desktop. In this blog post, I want to use it, to do some date intelligence, like… Continue reading
-
Power BI incremental refresh
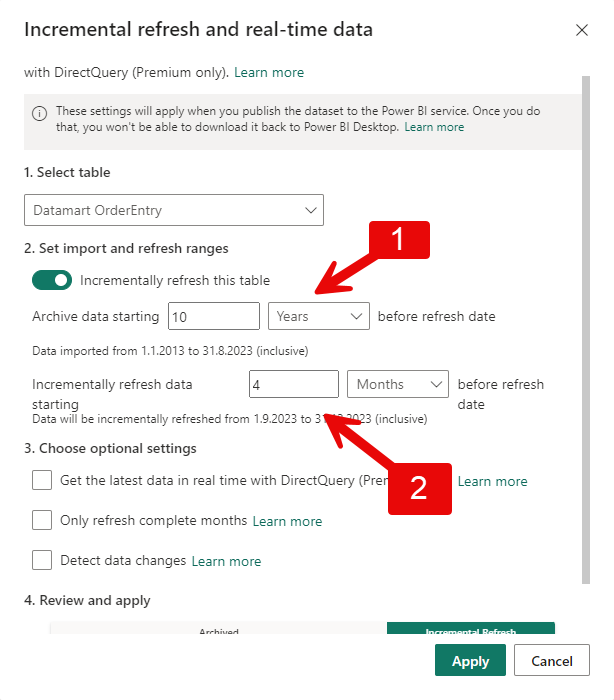
There are different reasons for why you want to update the Power BI semantic model incrementally. In this blog post, I will show you how to set up incremental refresh of a Power BI semantic model. Before we get started, there is some limitations you need to know. The changes need to made in power… Continue reading
-
Power BI Desktop on mac ->Sign in problem
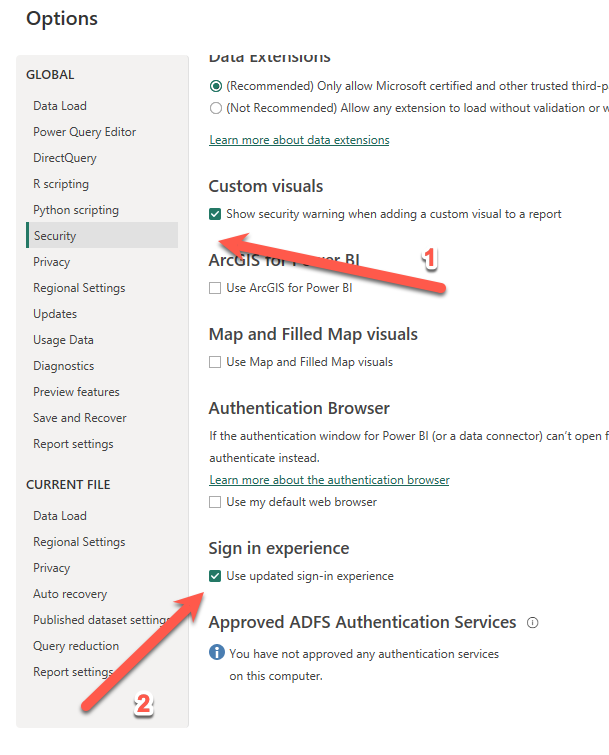
There has been a problem in Power BI Desktop on Mac, where you could not sign in. The problem has been, that when you click “sign in” in the top right corner, and type in your e-mail, then Power BI desktop will just freeze. Maybe the problem is only on parallels windows on arm version.… Continue reading
-
Power BI in developer mode with git integration between desktops and workspaces
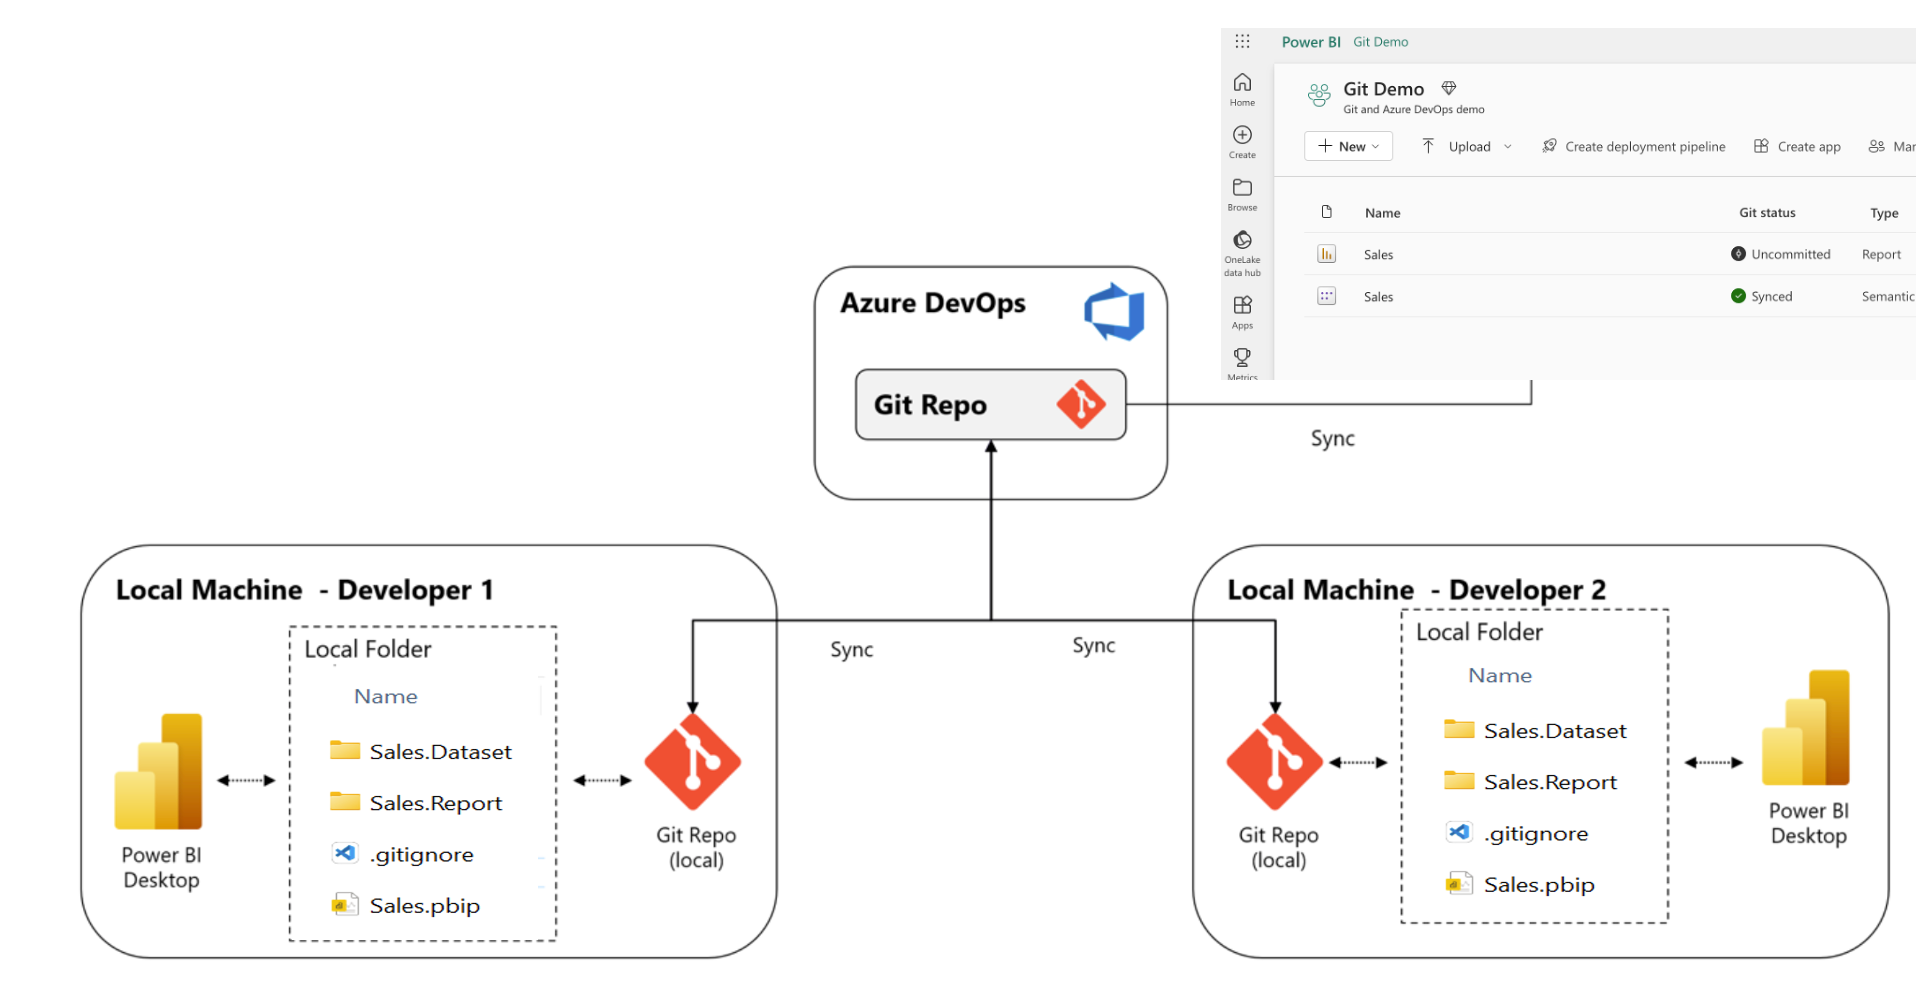
Introduction Source control in the Microsoft BI and datastack have always been a little hard to do. It was hard in the old days, with SSIS and SSAS, and it is also hard with Power BI. To name a few obstacles: There is of course also some major downsides with not using source control systems… Continue reading
-
Tip of the day 🙂 How to change the font size in your result grid in SSMS
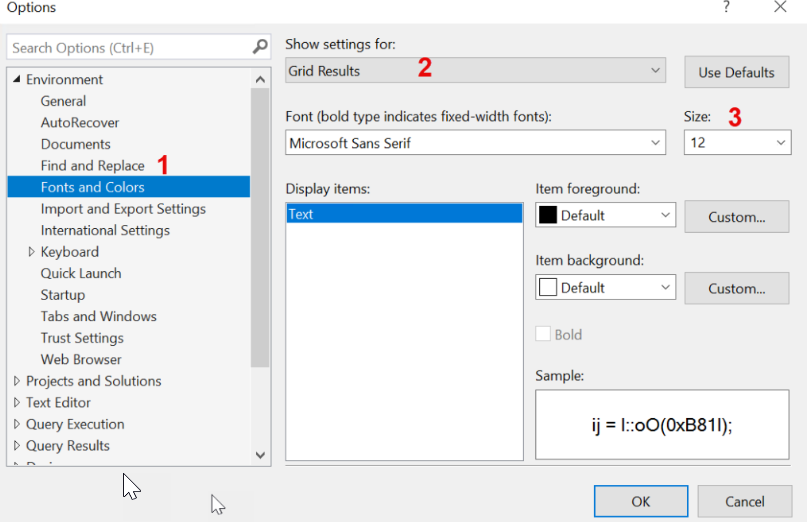
Just a nice litlte tip, so I can remember it myself if I need to change it again at some point 🙂 When you are presenting or sharing your screen with others, and they have another resolution than you, it can be hard to see the small things on the screen. In SQL Server Management… Continue reading
-
How to dynamically copy specific tables from source systems with Azure data factory
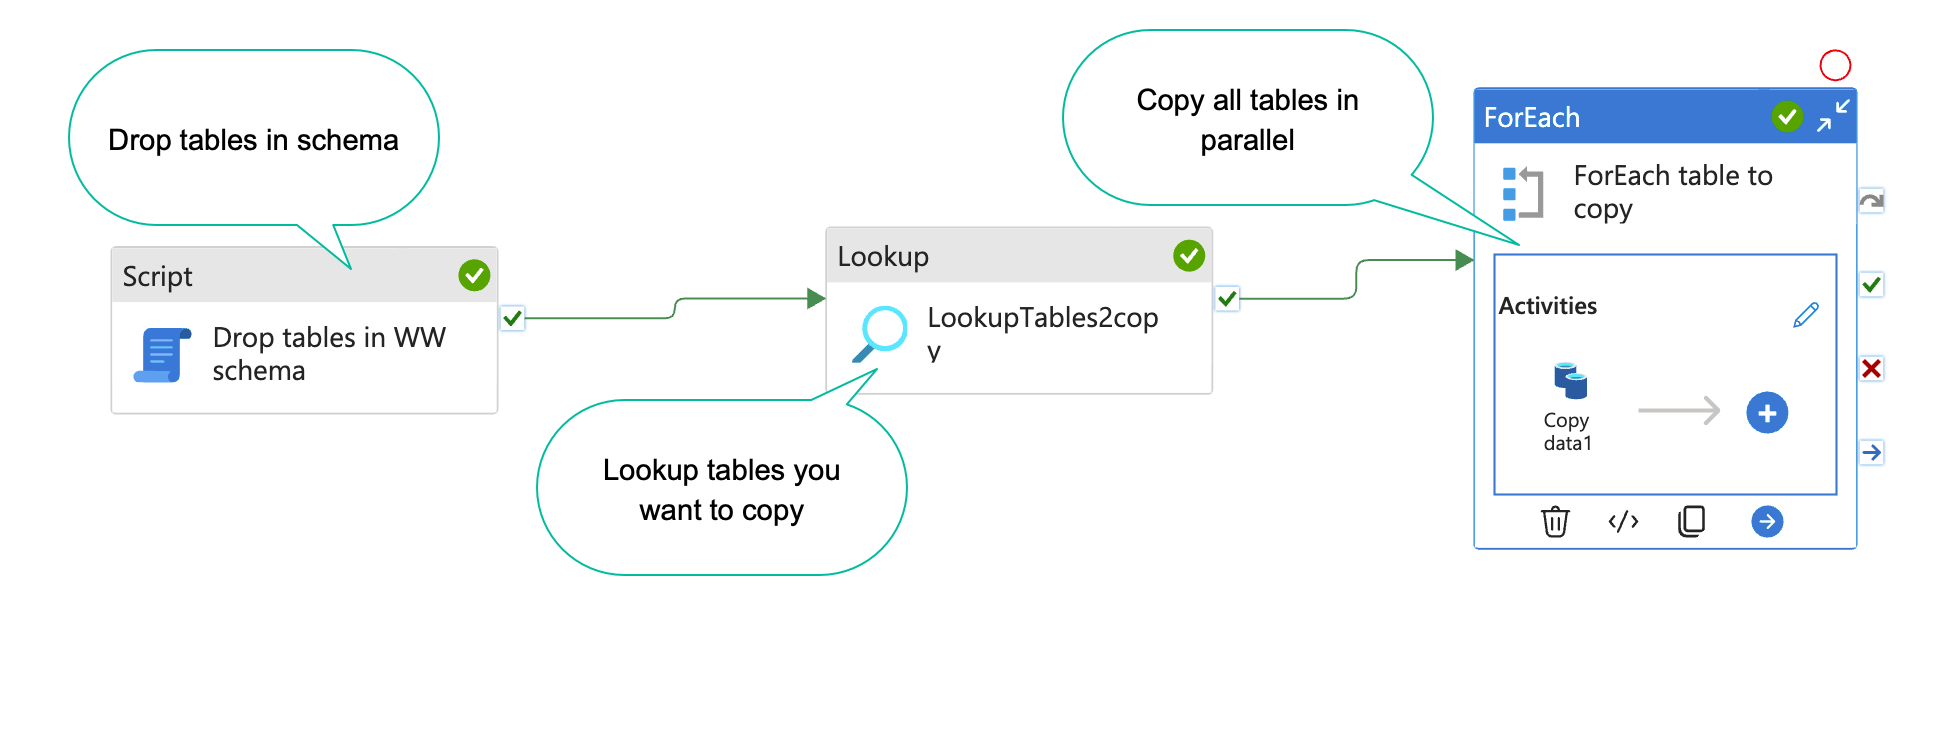
When you are working on a data project, you often have a list of tables you want to copy to your DWH database or staging database. With Azure data factory(ADF), this is easy to set up(Kind of). In this blog post, I will show you how. The result will end up looking something like the… Continue reading
-
Guide: Setup data factory to run locally
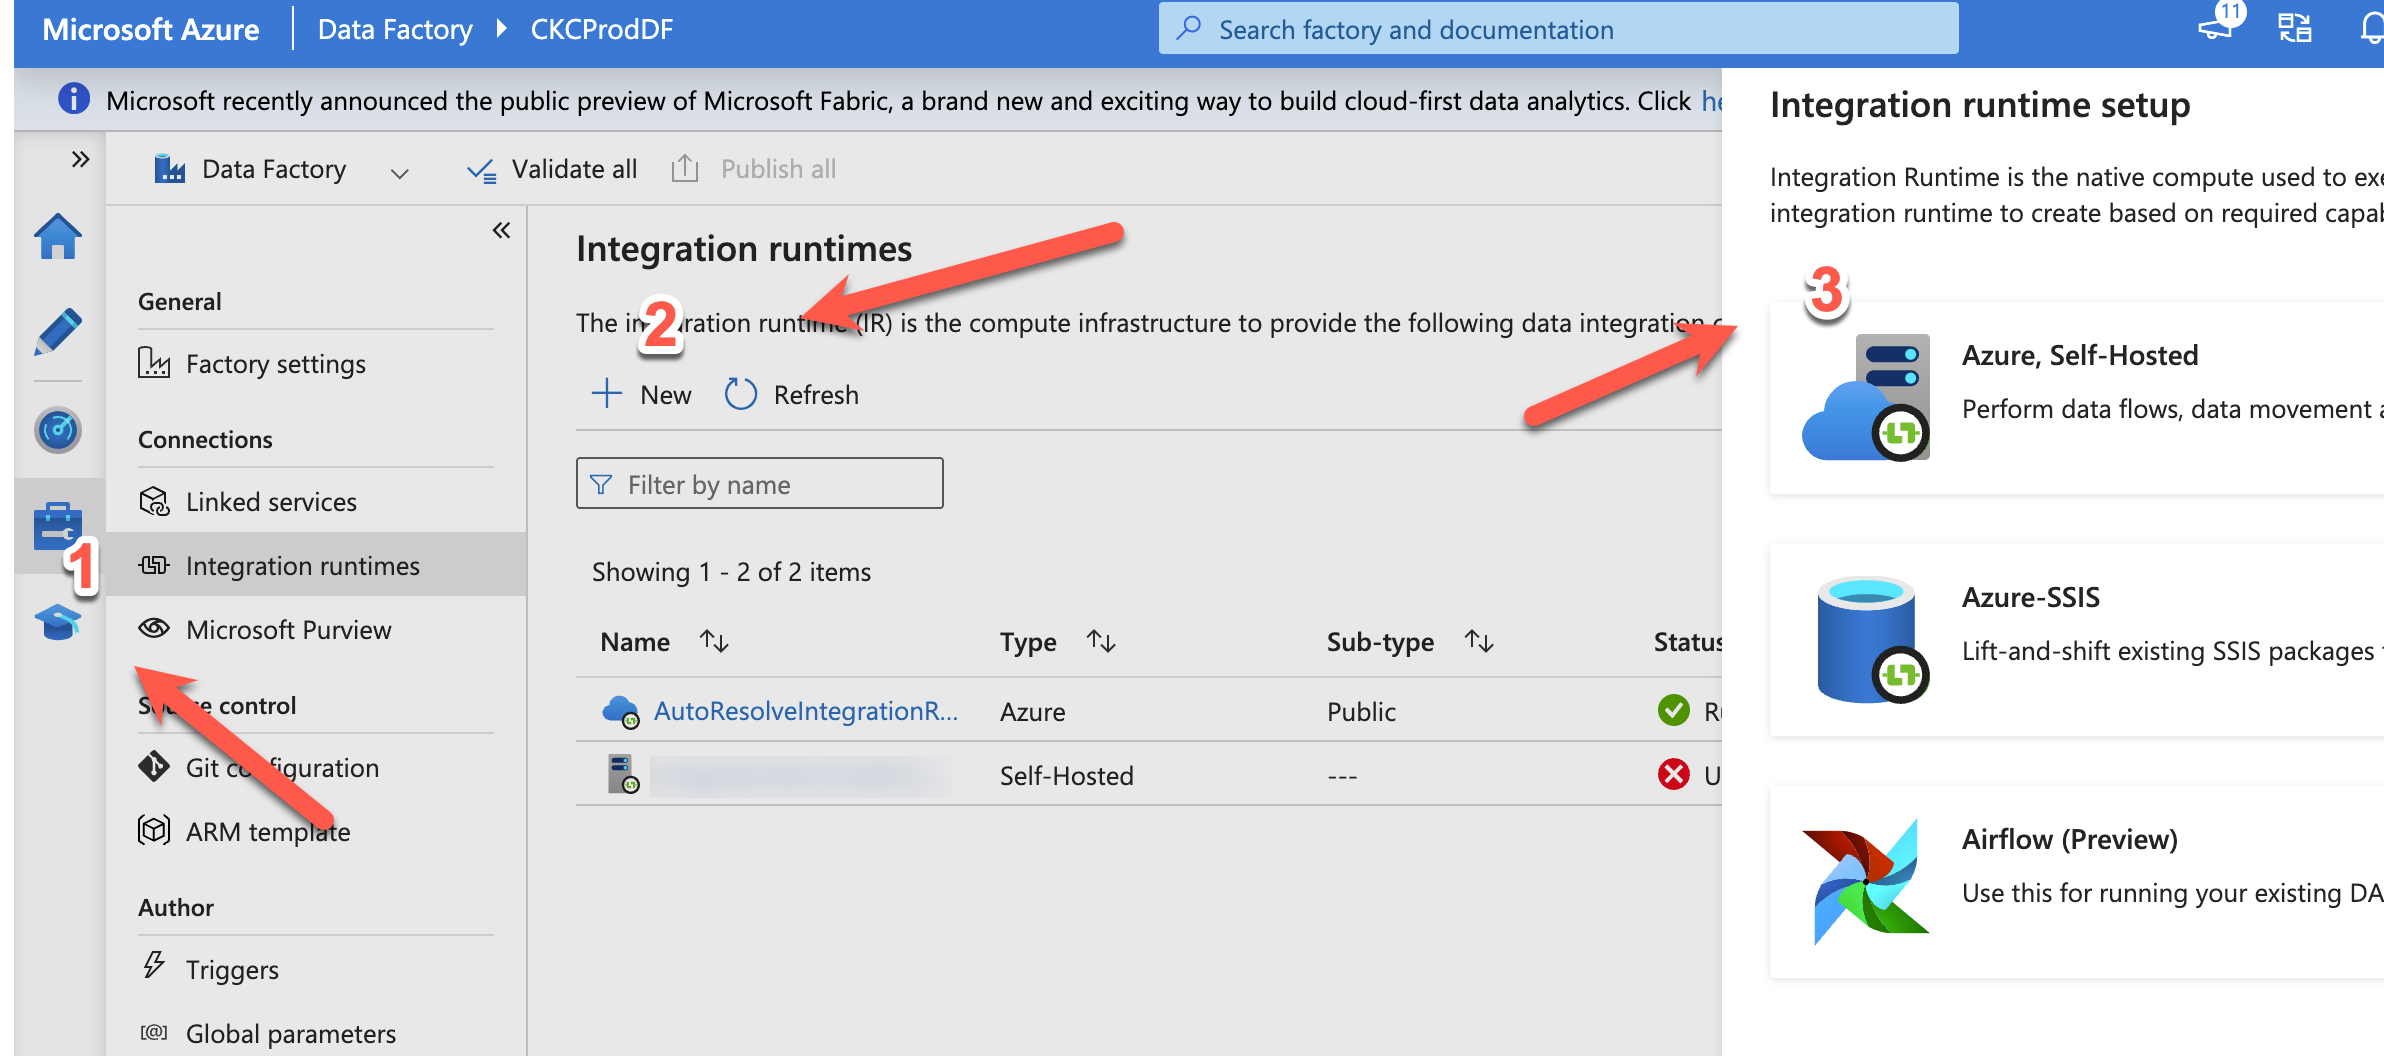
Azure Data Factory (ADF) is Microsofts cloud based ETL tool. It is in many ways, better than their old on-premise ETL tool “integration services”. Luckily, you can easily set up ADF to move data around on-premise. In this blog post, I will show you how 🙂 I will assume you already have an ADF running,… Continue reading
-
Refresh a Power BI dataset from data factory
When I have my data model in my Power BI dataset, there are several reasons, I want to update it when I am done with my ETL. Among others: So in this blog post, I will show how to do it from data factory (ADF). It is a lot of steps, and I will assume… Continue reading
-
How to scale your azure sql database with SQL
An Azure sql database is super easy and cheap to setup and use. However, if you want to do some serious data manipulation, you will find the cheapest versions are to slow to use, and every upgrade you make on the sql database, is a doubling in price. If you are a data engineer, like… Continue reading