
In the October 2023 update of Power BI desktop, we got the preview feature “Model explorer and Calculation groups”.
One of the great things about that update, is that we now can make calculation groups directly in Power BI desktop.
In this blog post, I want to use it, to do some date intelligence, like YTD, YTDLY, SPLY etc. We want to do this, so we don’t have to make these calculations for all the measures in our model, but make an easy to use way of applying it, to all of them.
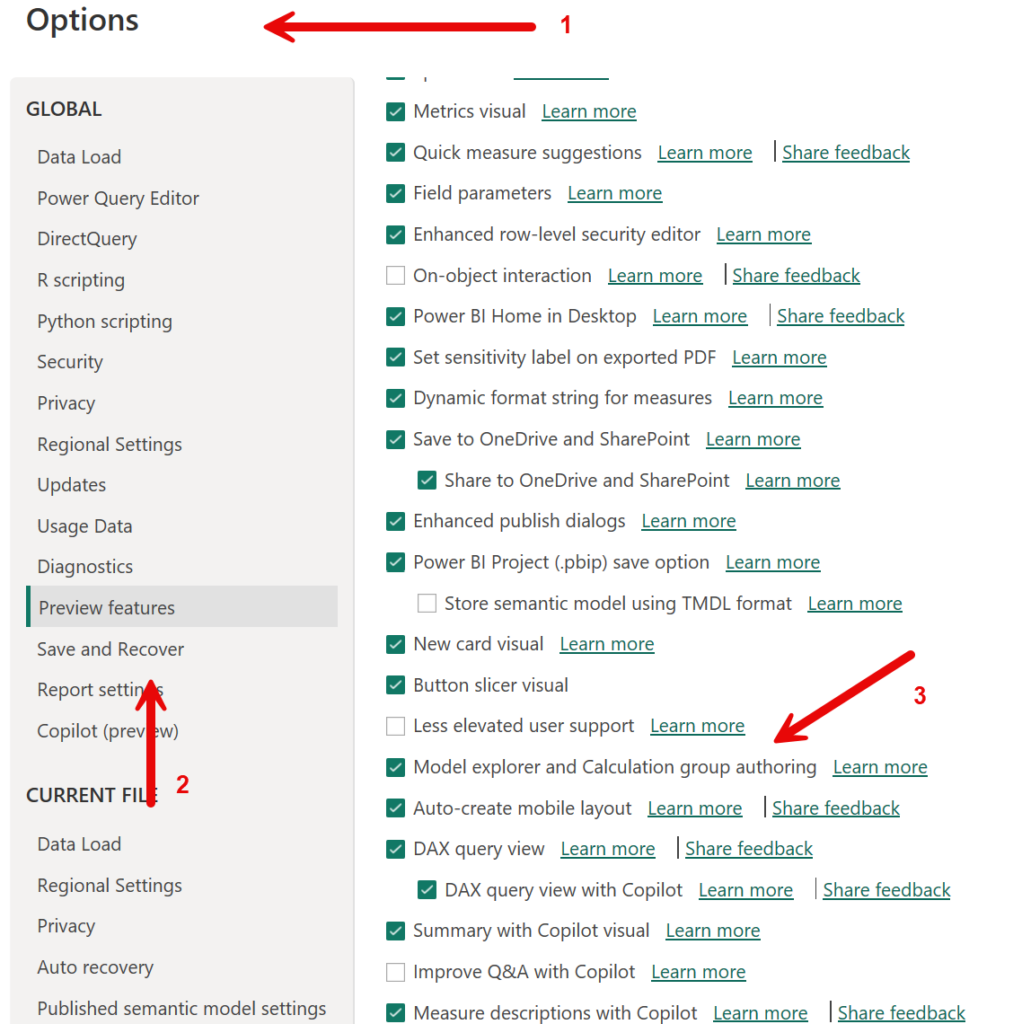
To enable it, do the following:
- Go to options
- Click preview features
- Enable “Model explorer and Calculation groups authoring”
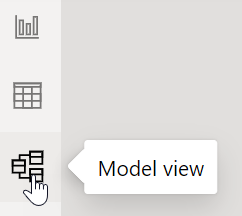
To use it in desktop, now go to your model view
And now under your data pane, you have a tables and model view.
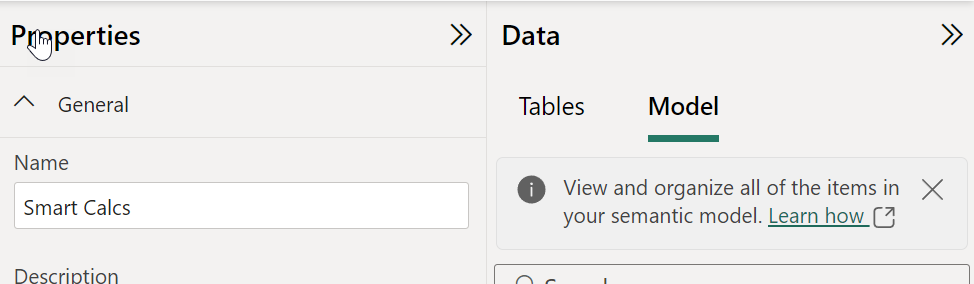
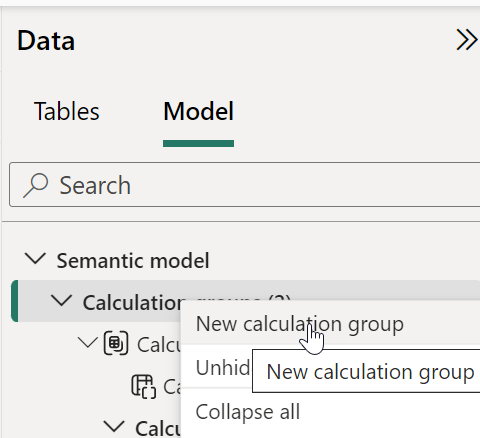
To create the calculation groups, select model, and click the 3 dots on “Calculation groups”, and select “New” Calculation group.
Rename the measure group to Date intelligence, click the 3 dots, and select add calculation items. For this blog, I created 4.
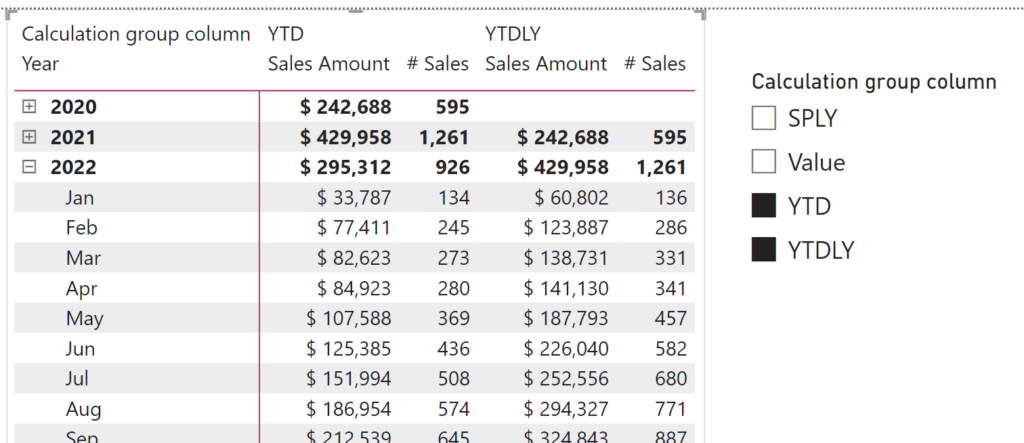
Value to show the selected value, and YTD, YTDLY and SPLY. The code, is in the code box below.
Value = SELECTEDMEASURE()
YTD = CALCULATE(SELECTEDMEASURE(), DATESYTD( 'Calendar'[Date] ) )
YTDLY = CALCULATE( SELECTEDMEASURE(), DATEADD(DATESYTD( 'Calendar'[Date]) , - 1 , YEAR ) )
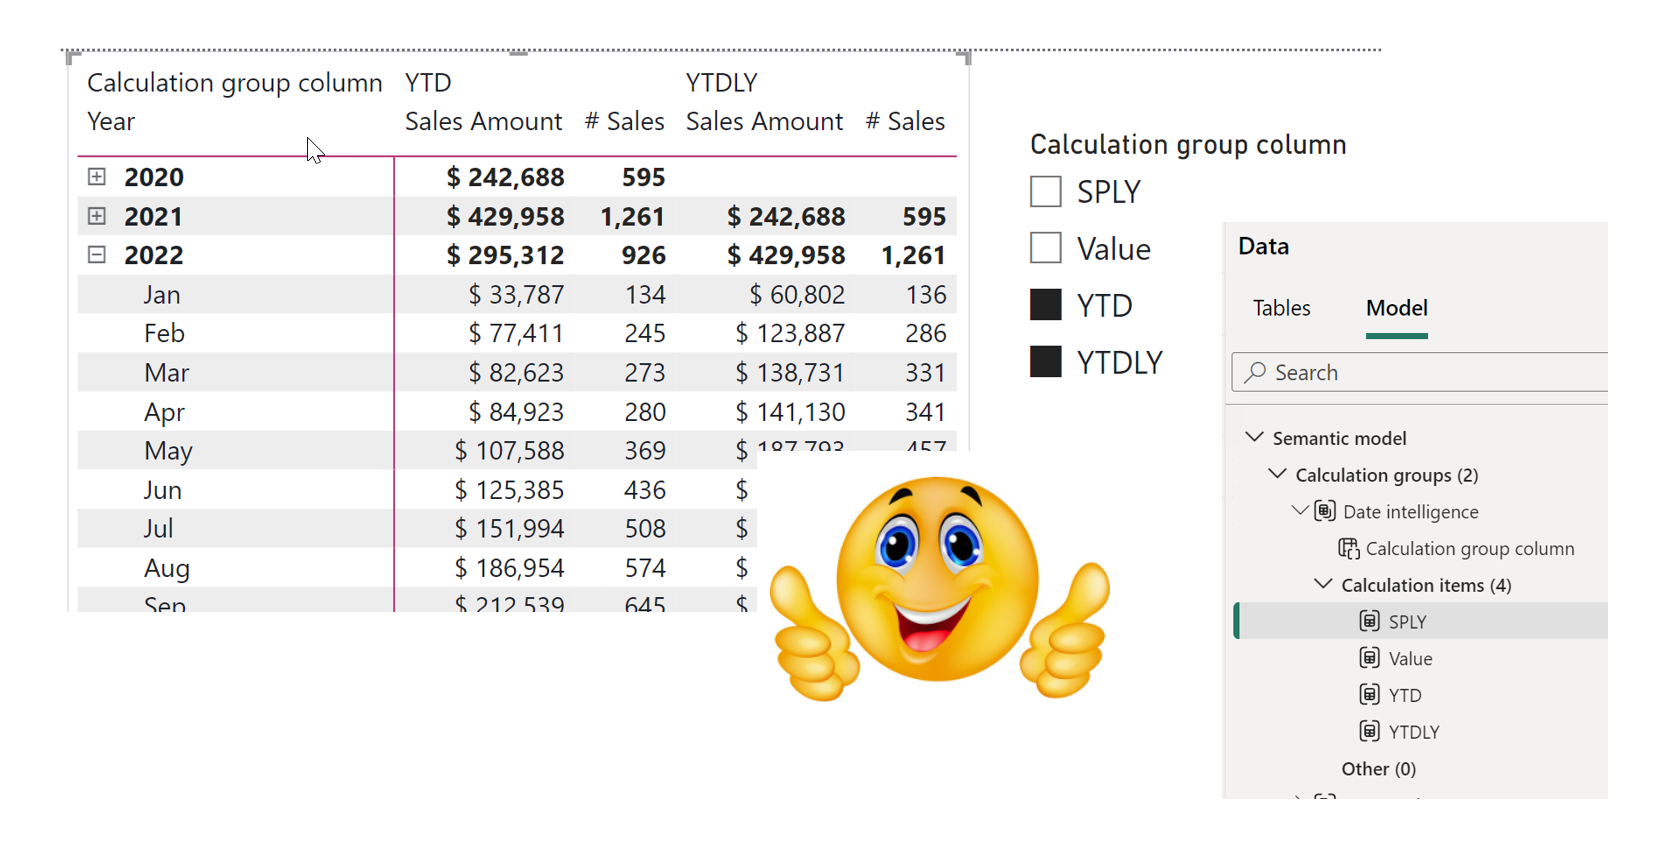
SPLY = CALCULATE(SELECTEDMEASURE(), SAMEPERIODLASTYEAR('Calendar'[Date] ))Now you can use the calculation group in your report view, like for instance in a matrix and a slicer like below
That it is. I hope you will find it usefull 🙂
Leave a Reply